top of page

Turning tedious data cleanup into a seamless, automated process

Read Time: 3 min
What is ThreatQ
In today’s cybersecurity landscape, security teams need to sift through massive amounts of data to understand and prioritize potential threats. This information often comes from various sources and tools that lack integration, leading to critical information being lost and responses to threats only after they escalate.
ThreatQ addresses these challenges by offering a robust platform that serves as a contextual library for storing and managing threat information in one centralized location.
The Problem
While ThreatQ offers a suite of tools for efficient data management, our users face a persistent challenge: the daunting task of removing irrelevant and outdated data from their systems.
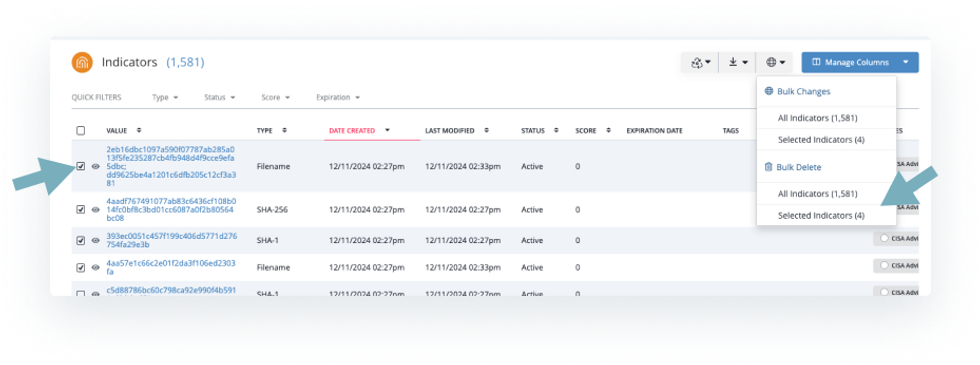
Currently, users have two primary methods to delete data:
Individual Selection:
Manually selecting and deleting records one by one.
Bulk Deletion:
Running bulk actions to delete large amounts of data at once.
In theory, these methods provide the necessary functionality. However, in practice, they are inefficient and extremely time-consuming.


Customers deal with information that quickly shifts from critical to Low risk.
Data is ingested daily, much of which is not relevant to the user’s specific sector or industry.
This influx of unnecessary data creates noise, distracts analysts, and slows down system performance.
Many users struggle to keep their databases up to date, leading to excessive data build-up, system degradation, and frequent support cases.
Understanding User Needs
From the inception of this initiative, it was clear that the feature needed to run automatically. However, automating the process alone does not ensure a successful policy. Setting the right parameters for automation ensures an effective policy.
Therefore, it was crucial to understand what additional information and requirements users needed to make their policies successful.
Through user interviews and feedback sessions, we identified the following key requirements:
Configuring the Policy
To give users full control over their policy specifications, we knew it had to be driven by Data Collections. These collections, similar to saved searches, allow users to filter and segment their data, then take action on the resulting subsets.
These collections are dynamic, so when new data meets the specified criteria, the data collection updates automatically. This approach not only meets the need for complete parameter customization but also ensures that data is constantly being pruned and deleted.

Users also wanted visibility into the impact of their policies before committing to them. To address this, we introduced a “Calculate Impact” feature. This tool allows users to see a projection of the number of records that will be deleted, broken down by object type, providing reassurance and clarity before finalizing their policy.

Defining Metrics That Have Impact
Throughout this project, what was top of mind for me and my team was to provide the right information to help our users make informed decisions about their policies. We knew we needed to provide a feedback loop to show users that their policies were working as intended. Rather than overwhelming users with unnecessary data, we focused on capturing the key insights they needed to evaluate their policies.
To start, we introduced two key metrics:
-
Total Objects Deleted
-
Object Types Affected

These metrics offer users an ongoing, tangible measure of their policy’s impact, allowing them to validate configurations and build confidence in the automation.
The second feature we introduced was an activity graph to give users a clear, visual representation of how their policy stacked up against newly created objects.
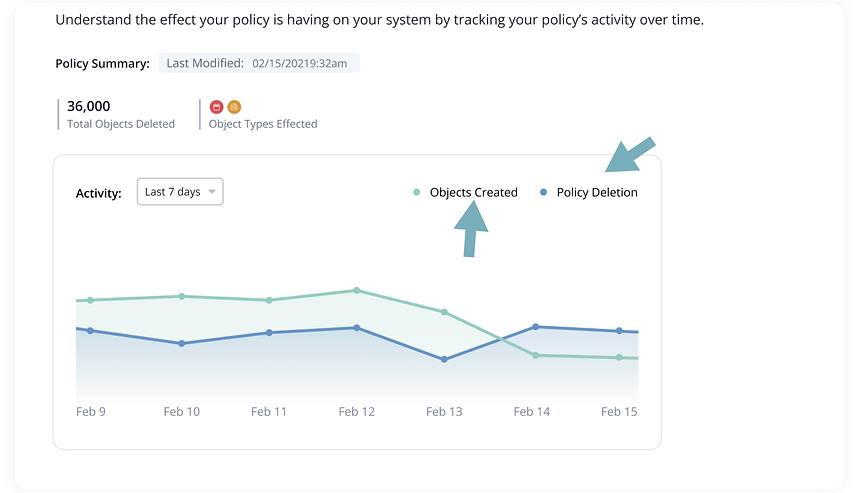
By comparing these two metrics, users can quickly identify if deletions are keeping pace with data ingestion, ensuring that excessive data build-up is avoided.
The graph allows users to switch between different timeframes, giving them the flexibility to analyze both short-term and long-term trends.
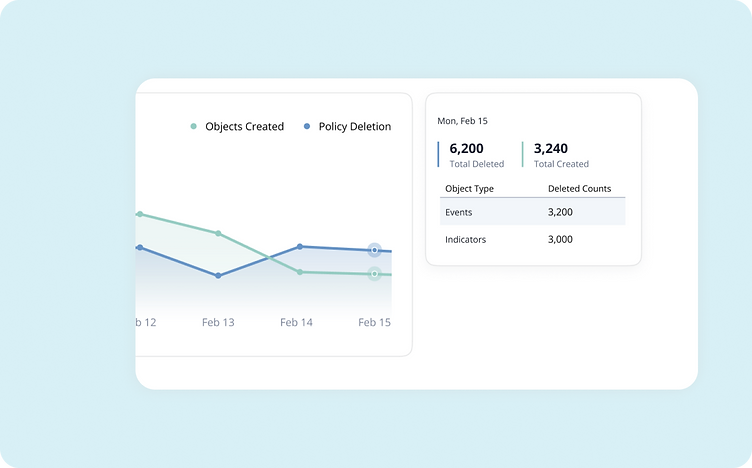

Hovering over a point on the graph highlights both trend lines and triggers an information popup displaying the total deletions and creations for that specific day, along with a detailed breakdown of how many objects were deleted by type.
This design provides users with the clarity and actionable insights needed to validate their policies, identify patterns, and make informed adjustments, ensuring their policies remain effective and impactful over time.

Conclusion / Result
The development of the Data Retention Policy directly addressed our users’ need for a more efficient and automated way to manage their databases. We prioritized creating a solution that required minimal effort to implement while ensuring it was reliable and effective. By incorporating visual tools like the activity graph, we allowed users to monitor and validate their policies with accuracy, ensuring irrelevant data was deleted while critical information remained intact.
This solution has now become a common practice for new customers when setting up their systems, serving as a proactive measure to prevent system overload. Widely adopted as a best practice, with 85% of our customers integrating it into their workflows, this feature has proven instrumental in maintaining system performance and reducing data-related inefficiencies.
bottom of page